PI staining method is based on the changes in features of cells, sub-cellular and molecular during the process of apoptosis. These changes include organelles change, nucleus change, change in cell morphology and cell membrane components. In this post, we are going to introduce the detailed information about detecting cell cycle with PI staining method.
Experimental details
1.The cells are collected by centrifugation. The supernatant is discarded, and then the cells are washed twice with cold PBS.
2.Prechilling 70% ethanol, fixed at 4℃ overnight or -20℃ long-term fixed(If it is fixed at or 4℃, it will be tested the next day. -20℃ long-term fixed can still be used in a month. It is better to test in a short time.)
3.Staining
Collecting cells by centrifugation, washing cells with 1 mL PBS, adding 500uLPBS with 50ug/mL ethidium bromide (PI), 100ug/mL RNase A, 0.2% Triton X-100, which then should be incubated at 4 ℃ for 30 min in the dark.
4.Flow cytometry
According to the standard procedure, using flow cytometry to detect nearly 20-30 thousand, and then analyzing cells with cell cycle and ModFit software. Using the FL2-w FL2-A to show the result and remove conjoined cells.
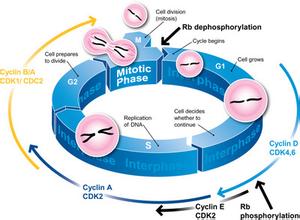
5. After the flow cell cycle, there are generally three parts: G0/G1, S, G2/M. If apoptosis exists, there will be a apoptosis peak in the G0/G1 phase(also known as sub-G0 phase), and if the cell window is not set properly during analysis, there may be cell debris peak.
Interpretation of results
1.G0/G1 phase cells account for 61.2% and the peak is at 45.76 of abscissa.
2.G2/M phase accounts for 13.07%, peak is located at 91.43 of abscissa.
3.S phase accounts for 25.73
4.G2/G1 is 2.0 (that is to say G2 phase cells accounts for four times, while the G1 phase is diploid cells, the ratio is 2)
5.Peak’s coefficient of variation is 4.54% (good)
6.Cell debris is 0.48%, cell aggregates are 0.06%.
7.The total number (instrument detected) cells are 17525.
8.The number of cells in the cell cycle analysis is 17,431 (ie excluding debris and aggregates)
9.CV is coefficient of variation. Usually the smaller the CV, the better peak shape, the more acute. It can be controlled at about 5%, generally less than 10% can be recognized.
These are some detailed experimental steps to detect cell cycle with PI staining method. As for this aspect, cell cycle protein array plays a very important role.
Experimental details
1.The cells are collected by centrifugation. The supernatant is discarded, and then the cells are washed twice with cold PBS.
2.Prechilling 70% ethanol, fixed at 4℃ overnight or -20℃ long-term fixed(If it is fixed at or 4℃, it will be tested the next day. -20℃ long-term fixed can still be used in a month. It is better to test in a short time.)
3.Staining
Collecting cells by centrifugation, washing cells with 1 mL PBS, adding 500uLPBS with 50ug/mL ethidium bromide (PI), 100ug/mL RNase A, 0.2% Triton X-100, which then should be incubated at 4 ℃ for 30 min in the dark.
4.Flow cytometry
According to the standard procedure, using flow cytometry to detect nearly 20-30 thousand, and then analyzing cells with cell cycle and ModFit software. Using the FL2-w FL2-A to show the result and remove conjoined cells.
5. After the flow cell cycle, there are generally three parts: G0/G1, S, G2/M. If apoptosis exists, there will be a apoptosis peak in the G0/G1 phase(also known as sub-G0 phase), and if the cell window is not set properly during analysis, there may be cell debris peak.
Interpretation of results
1.G0/G1 phase cells account for 61.2% and the peak is at 45.76 of abscissa.
2.G2/M phase accounts for 13.07%, peak is located at 91.43 of abscissa.
3.S phase accounts for 25.73
4.G2/G1 is 2.0 (that is to say G2 phase cells accounts for four times, while the G1 phase is diploid cells, the ratio is 2)
5.Peak’s coefficient of variation is 4.54% (good)
6.Cell debris is 0.48%, cell aggregates are 0.06%.
7.The total number (instrument detected) cells are 17525.
8.The number of cells in the cell cycle analysis is 17,431 (ie excluding debris and aggregates)
9.CV is coefficient of variation. Usually the smaller the CV, the better peak shape, the more acute. It can be controlled at about 5%, generally less than 10% can be recognized.
These are some detailed experimental steps to detect cell cycle with PI staining method. As for this aspect, cell cycle protein array plays a very important role.
 RSS Feed
